

Sharp Aktie 763257 / JP3359600008
| Kurse + Charts + Realtime | News + Analysen | Fundamental | Unternehmen | zugeh. Wertpapiere | Aktion | |
|---|---|---|---|---|---|---|
| Kurs + Chart | Chart (gross) | News + Adhoc | Bilanz/GuV | Termine | Strukturierte Produkte | Portfolio |
| Times + Sales | Chartvergleich | Analysen | Schätzungen | Profil | Trading-Depot | Watchlist |
| Börsenplätze | Realtime Push | Kursziele | Dividende/GV | |||
| Historisch | Analysen | |||||
Kurse + Charts + Realtime
News + Analysen
Fundamental
zugeh. Wertpapiere
|
16.10.2025 04:21:33
|
Bitcoin Price Wobbles — Is A Sharp Downside Move On The Horizon?
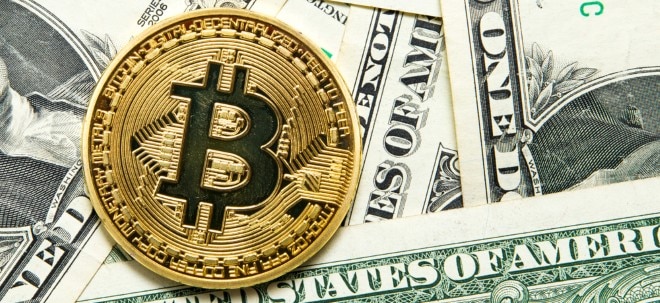
Bitcoin price is struggling to settle above $113,500 and $114,000. BTC is now consolidating and might start another decline below $110,000.Bitcoin started a fresh decline after it failed to clear the $114,000 resistance level.The price is trading below $113,000 and the 100 hourly Simple moving average.There is a bearish trend line forming with resistance at $112,000 on the hourly chart of the BTC/USD pair (data feed from Kraken).The pair might continue to move down if it trades below the $110,200 zone.Bitcoin Price Faces HurdlesBitcoin price started a recovery wave above the $112,500 resistance level. BTC recovered above the $112,800 and $113,000 resistance levels.The price climbed above the 50% Fib retracement level of the recent decline from the $115,975 swing high to the $110,000 low. The bulls even pushed the price above the $113,500 resistance level. However, there are many hurdles on the upside.Bitcoin is now trading below $113,000 and the 100 hourly Simple moving average. Besides, there is a bearish trend line forming with resistance at $112,000 on the hourly chart of the BTC/USD pair.Immediate resistance on the upside is near the $112,000 level. The first key resistance is near the $113,000 level. The next resistance could be $113,700 and the 61.8% Fib retracement level of the recent decline from the $115,975 swing high to the $110,000 low.A close above the $113,700 resistance might send the price further higher. In the stated case, the price could rise and test the $114,500 resistance. Any more gains might send the price toward the $115,250 level. The next barrier for the bulls could be $115,500.Another Decline In BTC?If Bitcoin fails to rise above the $113,000 resistance zone, it could start a fresh decline. Immediate support is near the $110,200 level. The first major support is near the $110,000 level.The next support is now near the $109,500 zone. Any more losses might send the price toward the $108,500 support in the near term. The main support sits at $107,200, below which BTC might struggle to recover in the short term.Technical indicators:Hourly MACD – The MACD is now gaining pace in the bearish zone.Hourly RSI (Relative Strength Index) – The RSI for BTC/USD is now below the 50 level.Major Support Levels – $110,200, followed by $110,000.Major Resistance Levels – $112,000 and $113,000.Weiter zum vollständigen Artikel bei NewsBTC
Nachrichten zu Sharp Corp.
3 Knaller-Aktien im BX Musterportfolio📈: Broadcom, Quanta Services & ING mit François Bloch
Im BX Morningcall werden folgende Aktien analysiert und erklärt
✅ Broadcom
✅ Quanta Services
✅ ING Group
👉🏽 https://bxplus.ch/bx-musterportfolio/
3 Knaller-Aktien im BX Musterportfolio📈: Broadcom, Quanta Services & ING mit François Bloch
Anzeige
Inside Trading & Investment
Anzeige
Mini-Futures auf SMI
Die Produktdokumentation, d.h. der Prospekt und das Basisinformationsblatt (BIB),
sowie Informationen zu Chancen und Risiken,
finden Sie unter: https://keyinvest-ch.ubs.com
Aktien in diesem Artikel
| Sharp Corp. | 4.29 | 0.99% |

|
Meistgelesene Nachrichten
Top-Rankings


Börse aktuell - Live Ticker
SMI und DAX fester -- US-Börsen freundlich erwartet -- Asiens Börsen letztlich mehrheitlich im PlusDer heimische Aktienmarkt und der deutsche Aktienmarkt legen zur Wochenmitte etwas zu. Die US-Börsen könnten weiter zulegen. Die Märkte in Fernost wiesen am Mittwoch überwiegend grüne Vorzeichen aus.